Visualisation systems
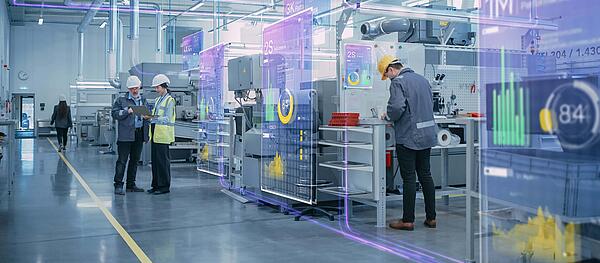
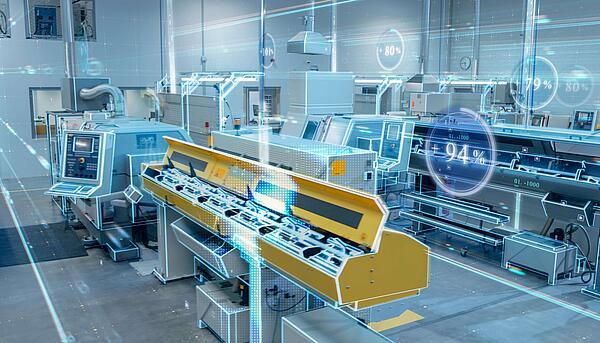
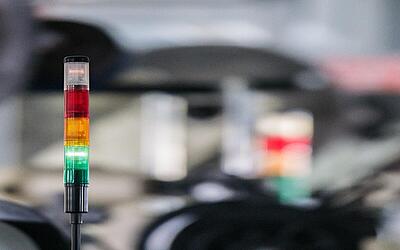
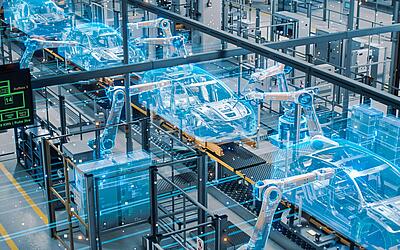
The current status of all live production processes at a glance – that is top-level lean management. IoT-compatible visualisation systems are increasingly being used on the digital shop floor to realise the complete transparency of data from different sources. With the help of systems such as stack lights, Andon boards or digital dashboards, complex data and information can be visualised in real-time, achieving transparency for all production workers.
Highlights
- Individual dashboards are easy to create
- Visualisation of sensor data in real time
- Dashboard presentation on any chosen screens
- Process deviations immediately visible, no downtimes
- Flexible integration and simple retrofitting in existing production plants
Applications
Various nexy visualisation solutions make live production processes and steps visible, register changes to processes, display plant utilisation and identify potential points of failure. The different modules allow for a range of presentations – always suited to the application in question and its relevant information.

Guarantee stability of production processes through real-time visualisation
Whether Andon, Kanban or logistics boards – the nexy visualisation systems are as varied as the potential applications. Different modules mean that different information can be presented in a comparatively small space.
Digital Andon boards visualise error messages and production steps, as well as plant utilisation and enterprise resource planning, clearly and transparently for all persons on the shop floor. Through the transfer of data in real time, the occupancy of storage slots or storage areas can be visualised to the second, for example.
Visualisation makes relevant information immediately understandable for production workers. Impending bottlenecks or points of failure can be detected early, and new instructions given and implemented immediately, considerably improving the stability of production processes.


